
CK-12 Foresights & Insights
Helping teachers decide when and how to support a student, without confusing a prediction with an explanation.
- Role
- Lead Product Designer
Experience architecture, interaction model, prototypes, and visual language
Product case study
Teachers saw value in the tools. Published reviews also found that half struggled with each tool’s central chart.
On this page
Context
Before assigning work, a teacher needs to know who may need support. Afterward, they need to understand what happened and what to do next. A score alone cannot answer both questions.
Foresights and Insights connect those moments. The challenge was to make a model's signals useful without making them look more certain, or more explanatory, than they were.
Scope
As Lead Product Designer, I owned the experience architecture, interaction model, prototypes, and visual language. I worked with educators, Product, Data Science, and Engineering to connect the analytics to classroom decisions.
The interface work is my contribution. The studies cited below are CK-12's published evaluations, and their findings are attributed separately.
Decision 01
Combining everything into one performance score would make scanning easier, but blur two different jobs. Foresights supports planning before an assignment. Insights supports investigation after students have worked.
I structured the experience around those moments: anticipate where support may be needed, inspect the evidence that comes back, then decide what to change. This keeps a prediction from becoming an explanation of a student's behavior.
Two moments, connected
- Before: anticipate supportForesights
- Students practice
- After: investigate evidenceInsights
- Teacher chooses the next action
Decision 02
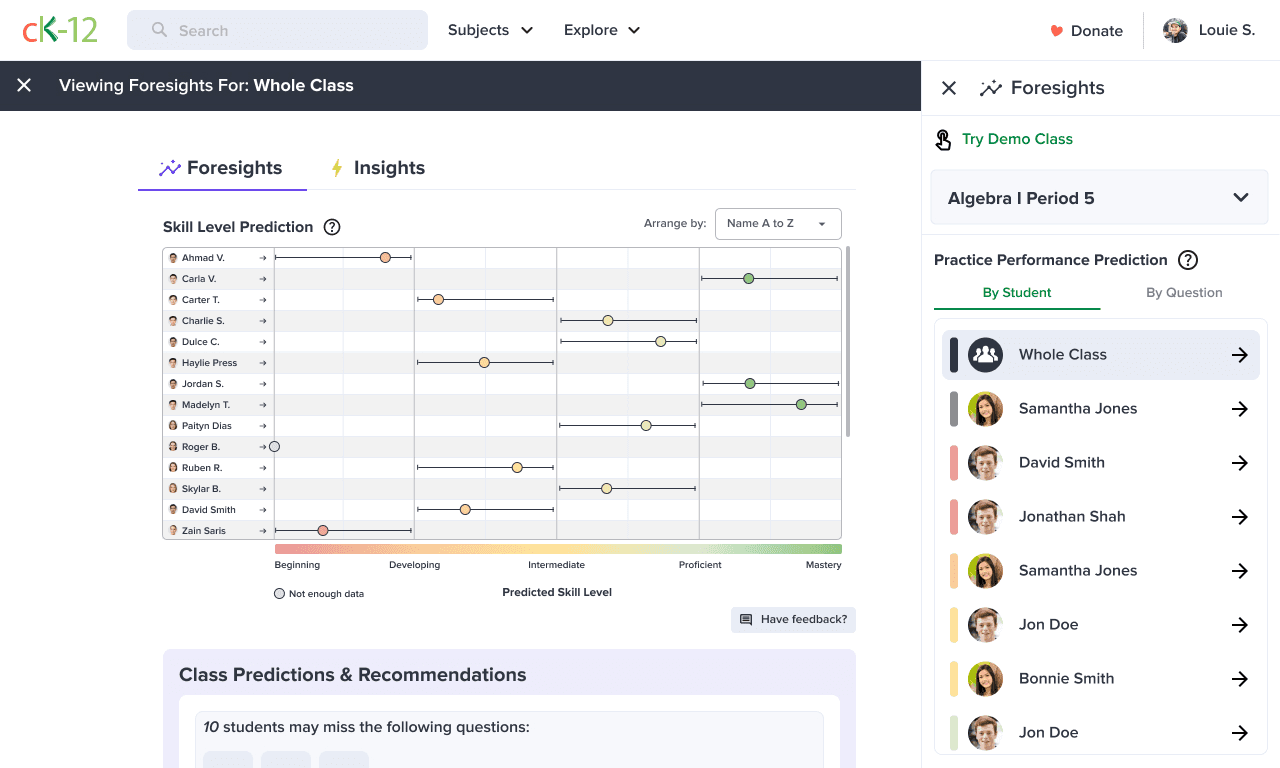
A single predicted value is easy to rank and easy to overread. The Foresights view uses ranges to make uncertainty visible. Missing or limited evidence also matters: an absence of data should not read as an absence of ability.
The range chart at the top of this page is the supplied demo-class interface. It makes uncertainty visible, but visibility is only the first step. Teachers still have to understand what the range permits them to conclude. The later comprehension results show why that distinction matters.
Decision 03
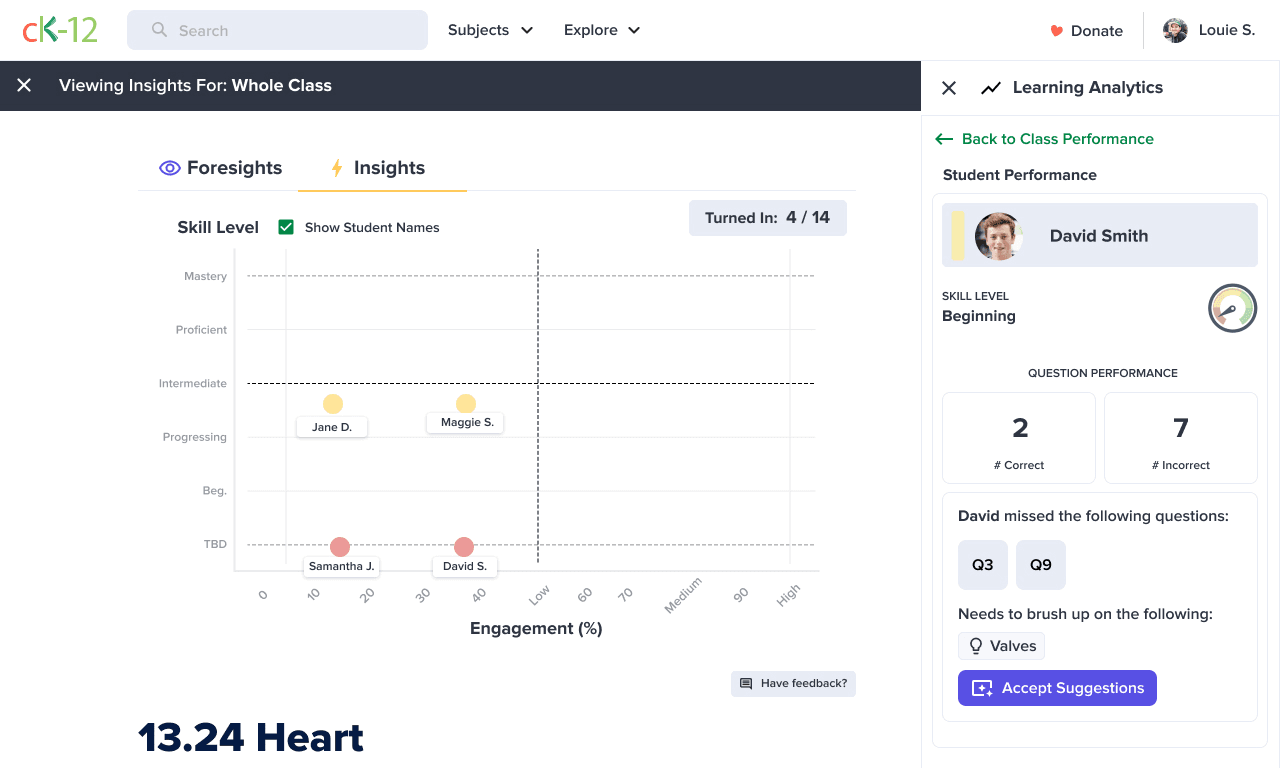
Low performance can come with very different patterns of effort. Collapsing skill and engagement into one score hides that difference. Insights separates the signals so a teacher can notice a class pattern and inspect an individual student before acting.
The interaction moves from overview to student detail. The goal is to support an investigation, not let the chart prescribe an intervention on its own.
System consequence
A teacher can act more precisely when the evidence refers to a particular concept. An assignment spanning several concepts makes a single result harder to interpret. The design therefore exposed a dependency between content structure, assignment structure, and the quality of the teacher's decision.
This is a system constraint, not something chart styling can resolve. The case study does not attribute a broader curriculum or platform change to this interface work.
From content to a decision
- Concept
- Assignment
- Evidence
- Teacher interpretation
- Next action
Evaluation
CK-12's published evaluations each involved ten teachers using a demo class. They measured perceived usefulness and comprehension, rather than classroom learning gains or actual time saved.
| Reported measure | Foresights study(opens in a new tab) | Insights study(opens in a new tab) |
|---|---|---|
| Found it meaningful | 70% | 90% |
| Anticipated time savings | 90% | 100% |
| Mean comprehension score | 75% | 73% |
| Had difficulty with the key graph | 50% | 50% |
The graph difficulty is the important counterweight to the positive usefulness ratings. A valuable concept can still demand too much interpretation. These small evaluations support that design question; they do not establish broad adoption or a causal learning outcome.
Next iteration
My next iteration would start with a plain-language interpretation and let the teacher inspect the chart as supporting evidence. I would test whether teachers can explain the uncertainty, identify what they do not know, and choose a defensible next step with a real assignment.
The result I would look for is better interpretation, not simply a higher usefulness rating. The related student-facing question appears in Flexi: helping students get unstuck.