

 Experiment
Roster math for athletes deciding whether to transfer
- Mobile
- Product design
- Data product
TransferSight: a report that tells a college football player where they'd project to start, and whether staying is the better call. My own product, in progress: the landing page and data pipeline are live; the app is designed, not built.
- Problem
- College football players who sit behind upperclassmen often pick a transfer school in a few days, on a coach's pitch. The rosters and stats that show where they would actually play are on public school pages, but nobody puts them together for the athlete.
- What I did
- I'm designing and building my own product: a phone-first flow from an athlete's name to a ranked fit report, a live landing page with a waitlist, and a data pipeline that stores every FBS roster page each week.
- Result
- The landing page and waitlist have been live since September 30, 2026, and all 138 FBS roster pages have been stored and parsed weekly since October 3. The app is designed, not built, and the athlete and parent interviews have not happened yet.
My own product, in progress. The landing page and waitlist are live; the app is designed but not built. Every athlete, school, and number in the screens is demo data. Not affiliated with the NCAA or any school.
Visit the live site(opens in a new tab)
The problem
College football players who sit behind upperclassmen, the backups and rotation players, can leave through the transfer portal. The next football window is expected to open in January 2027 and run about 10 days. Transfer decisions happen in days, usually on a coach's pitch.
The facts that would answer "where would I actually start?" are public: school roster pages, published season stats, and who is graduating. Nobody puts them together for the athlete.
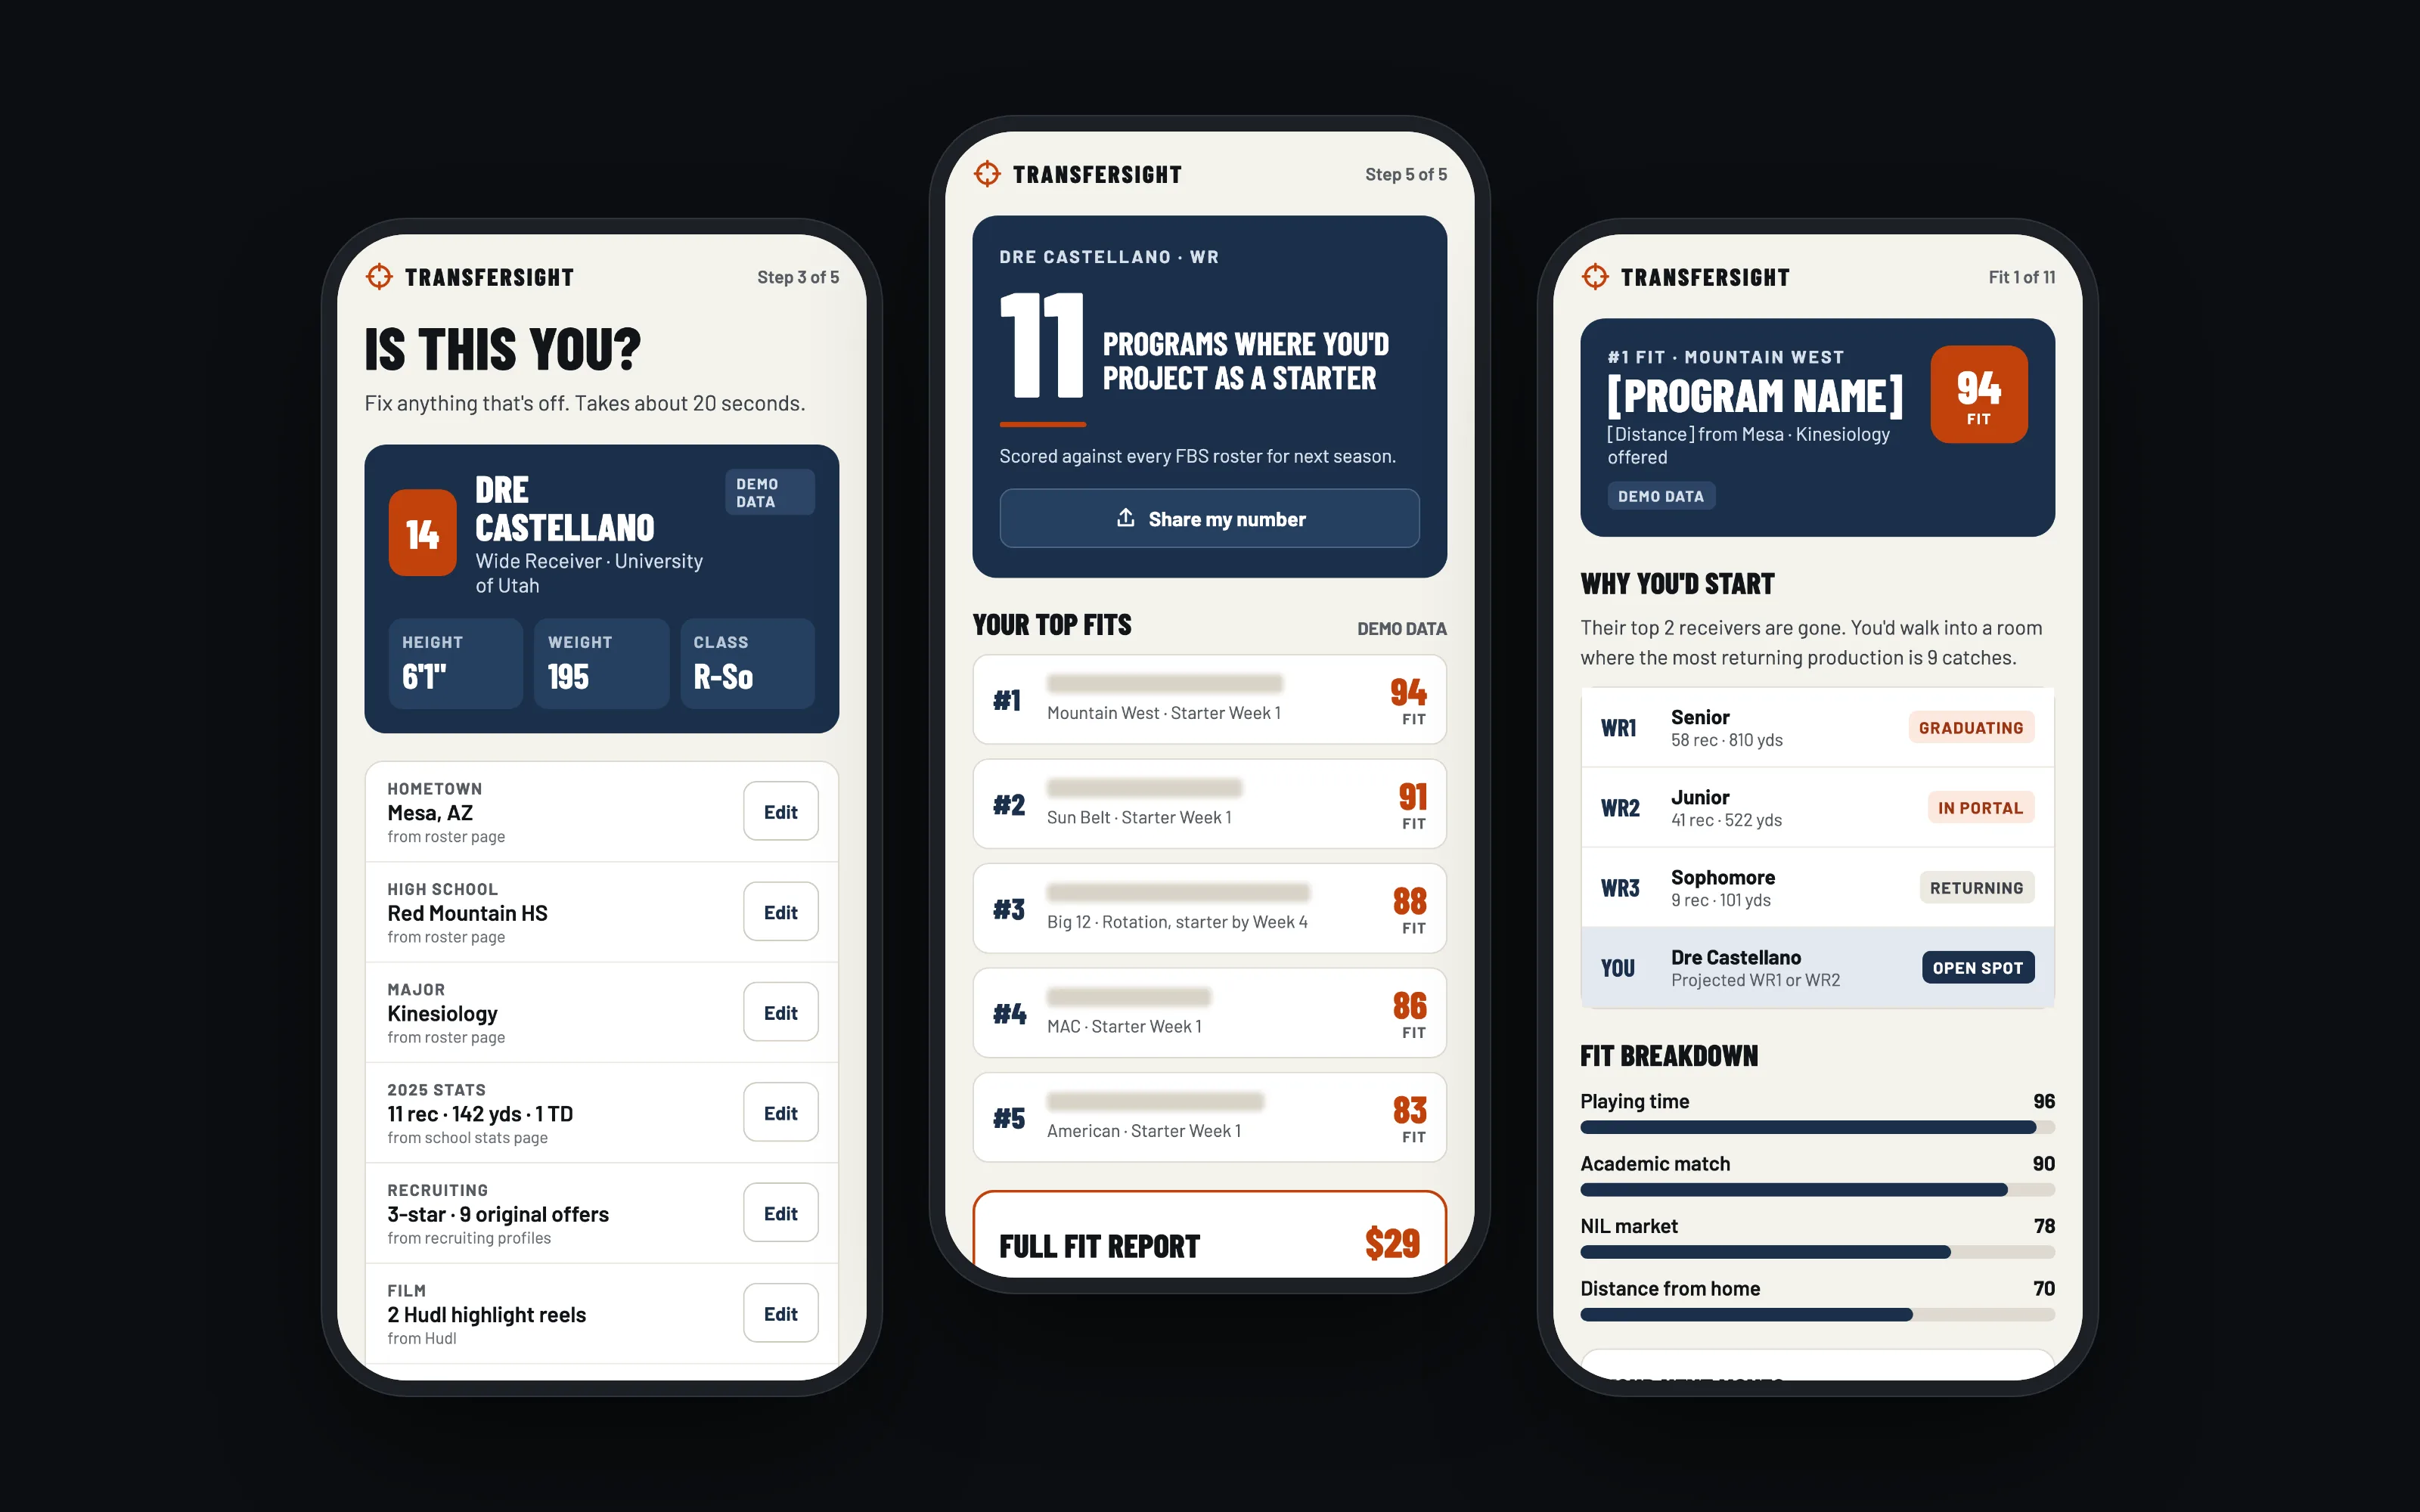
TransferSight does. An athlete enters a name and a school. It finds their roster page, stats, film, and recruiting history; they confirm it and answer 6 questions; they get a free number, how many programs they'd project as a starter at, and a "stay or go" read. The full ranked report is paid.
Three groups use it: athletes weighing a transfer, parents, who are probably the ones who pay, and private trainers, who can refer athletes for a share of each sale.
The app flow
The app is for 19 to 23 year old athletes and their parents, and its flow is drawn at phone size, 390 points wide. Each screen does one job, and a step counter says how far along you are.
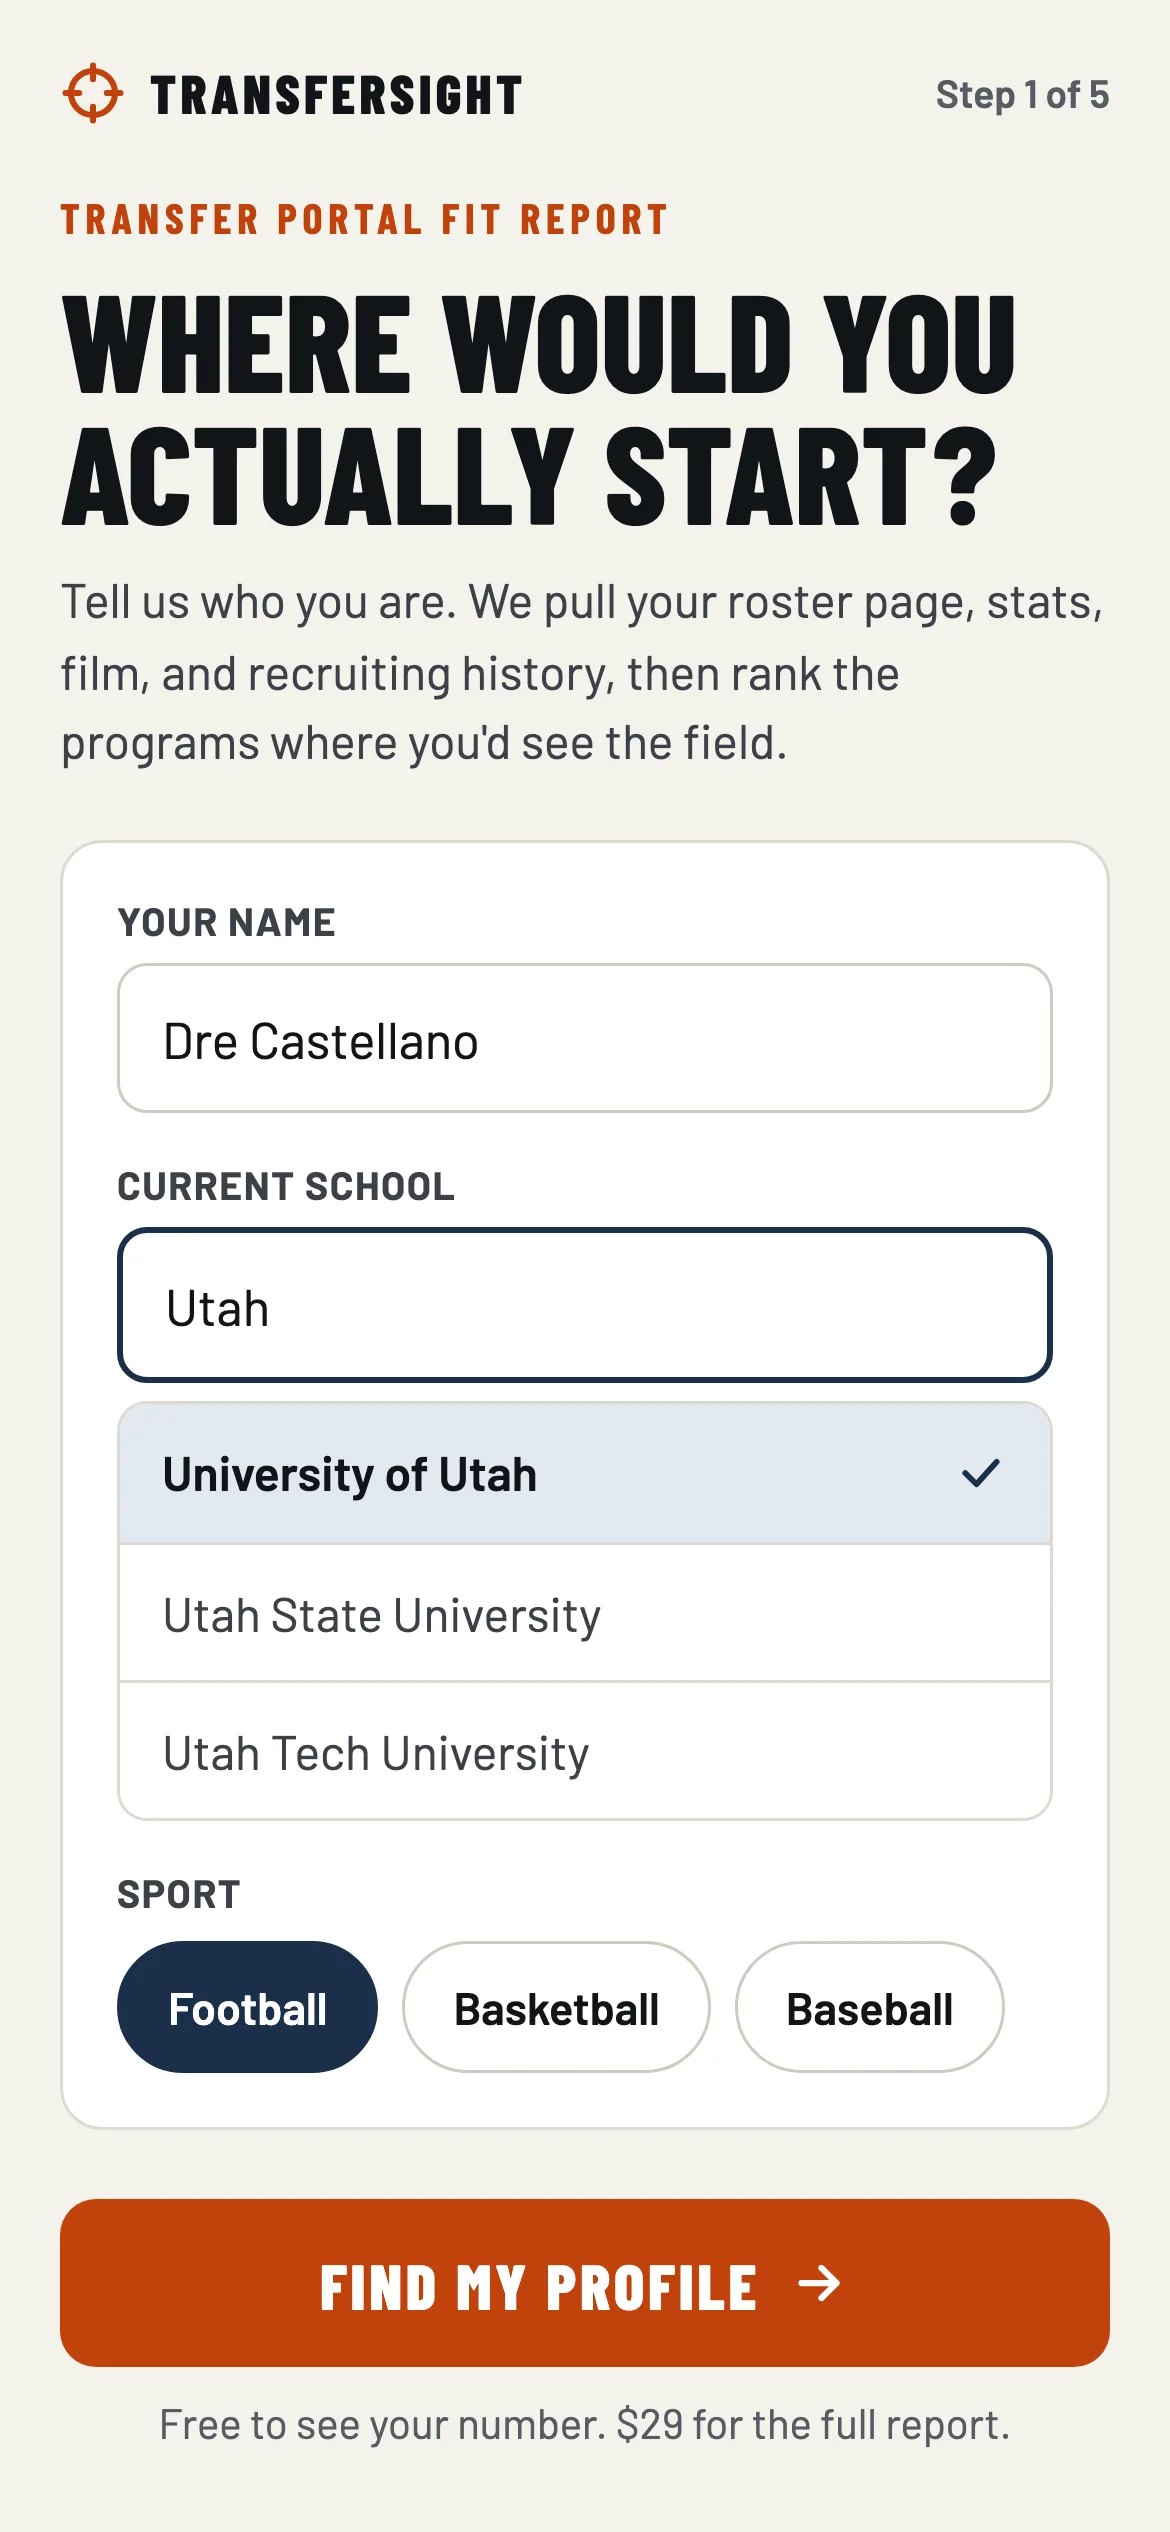
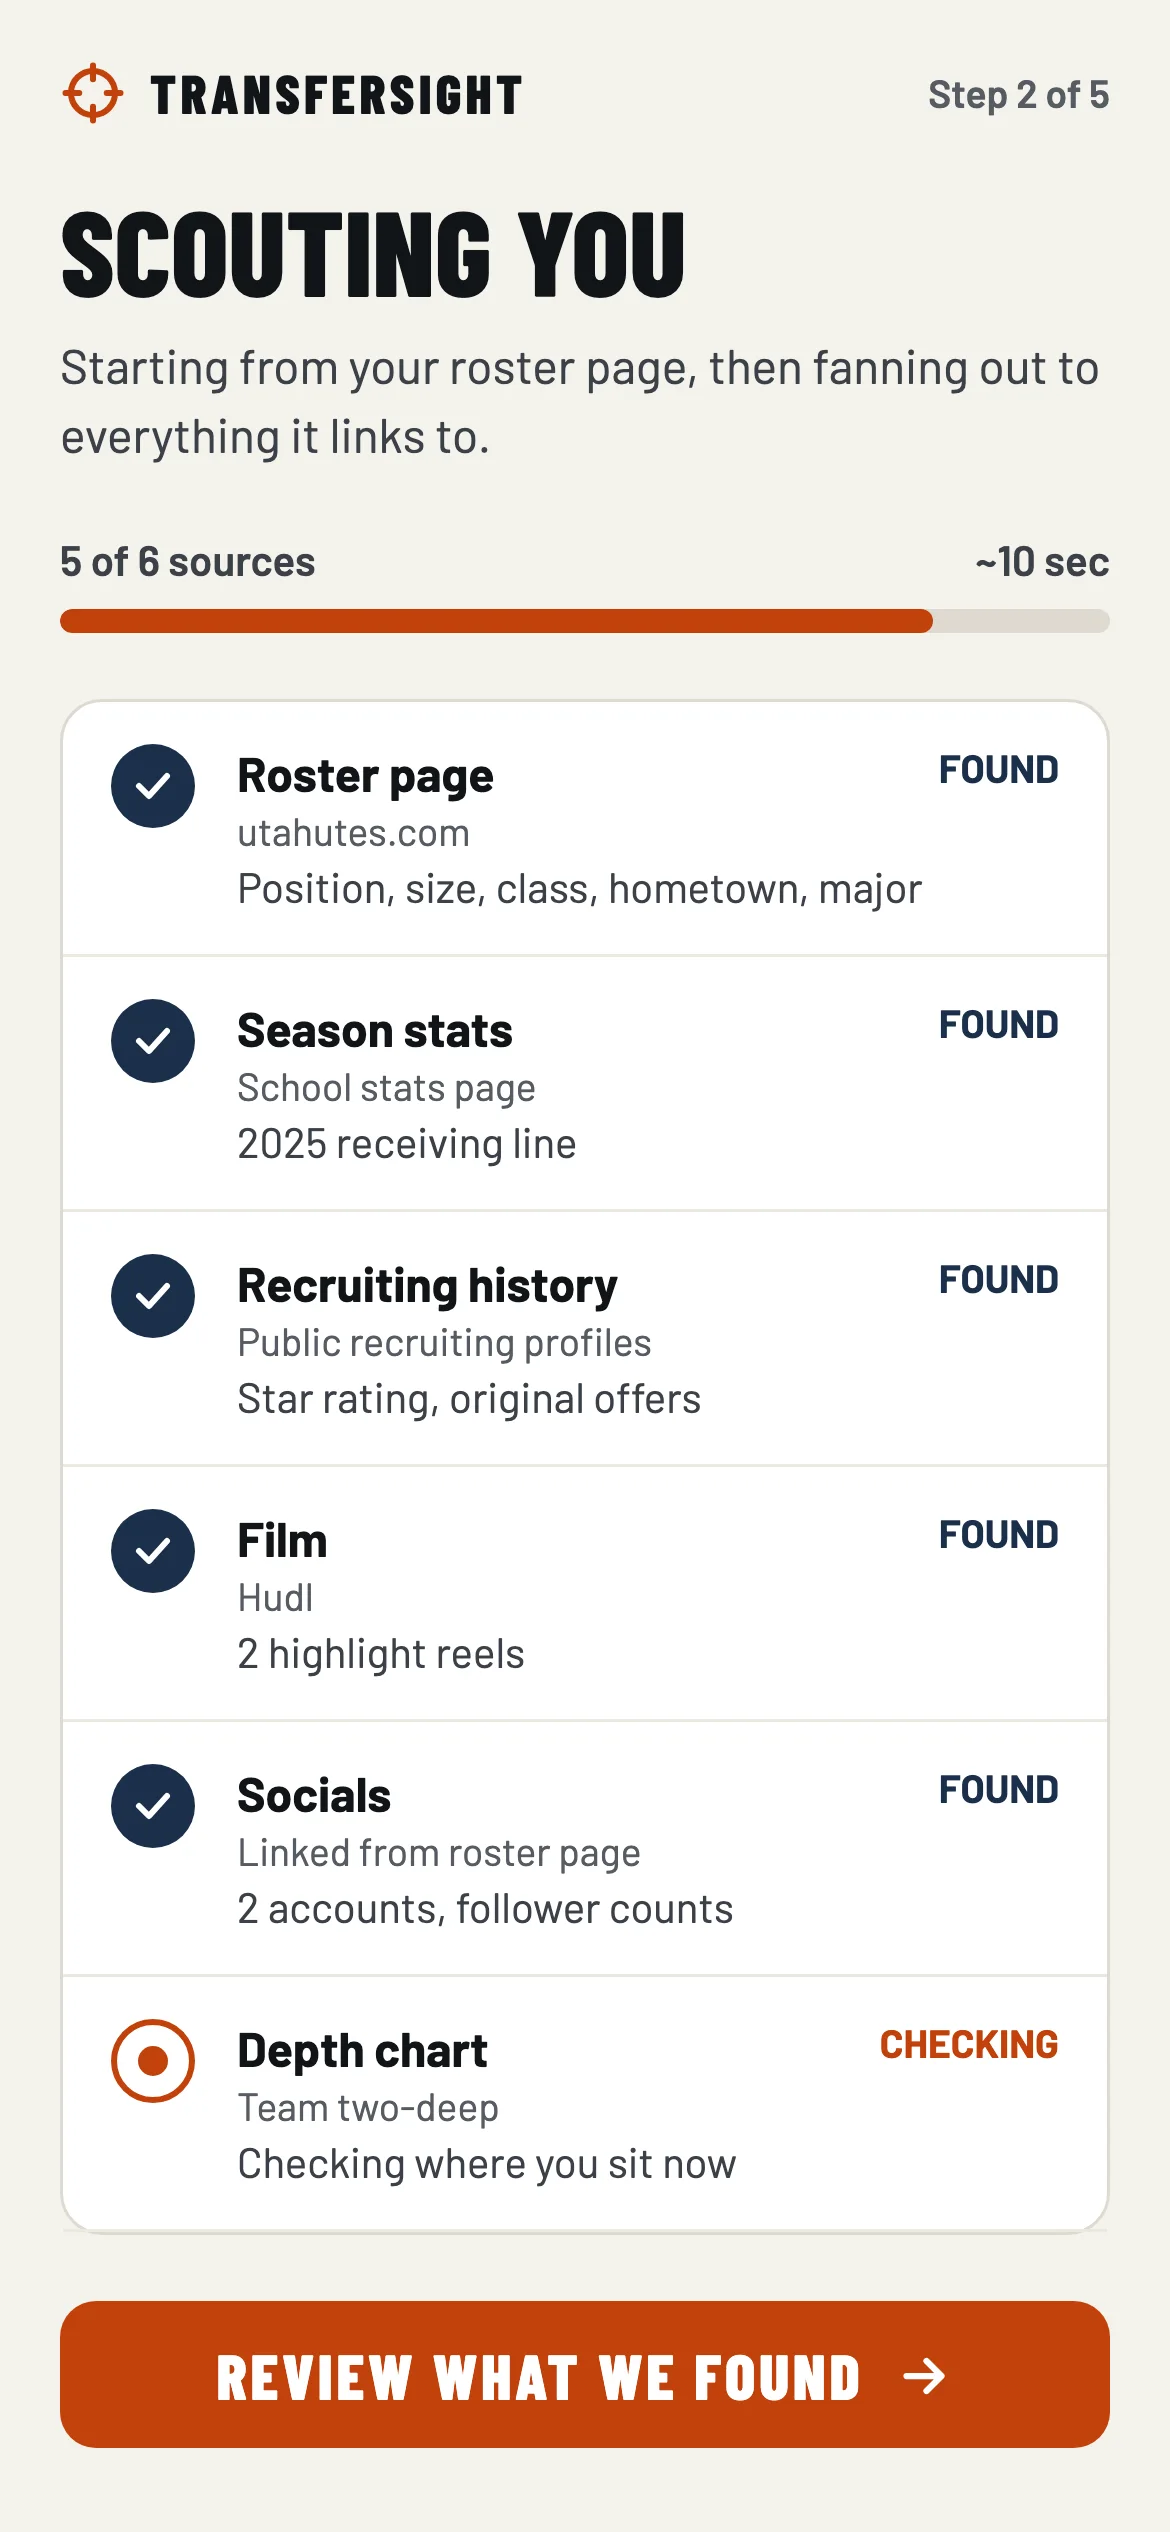
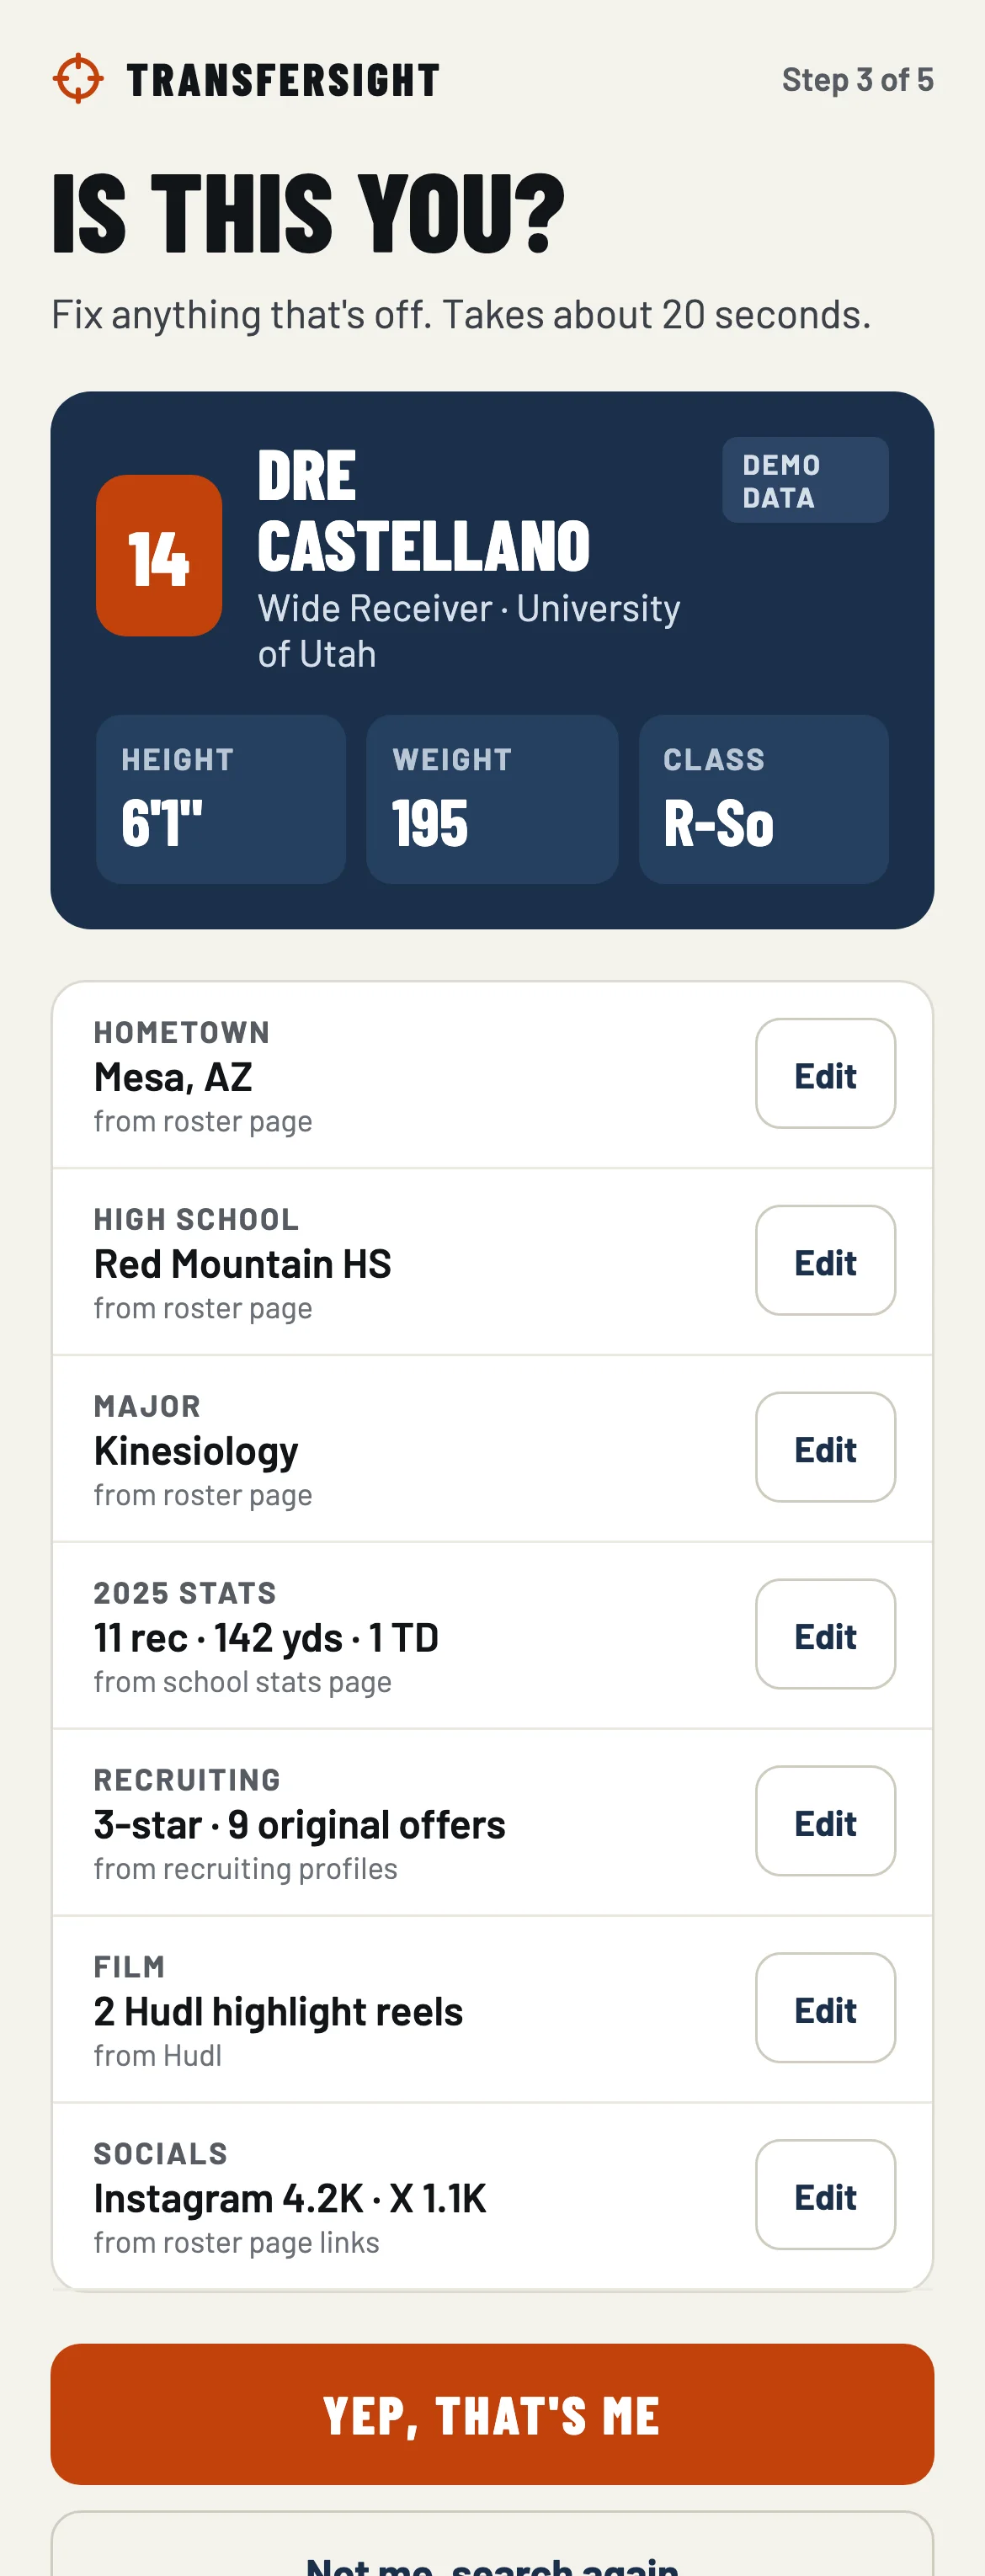
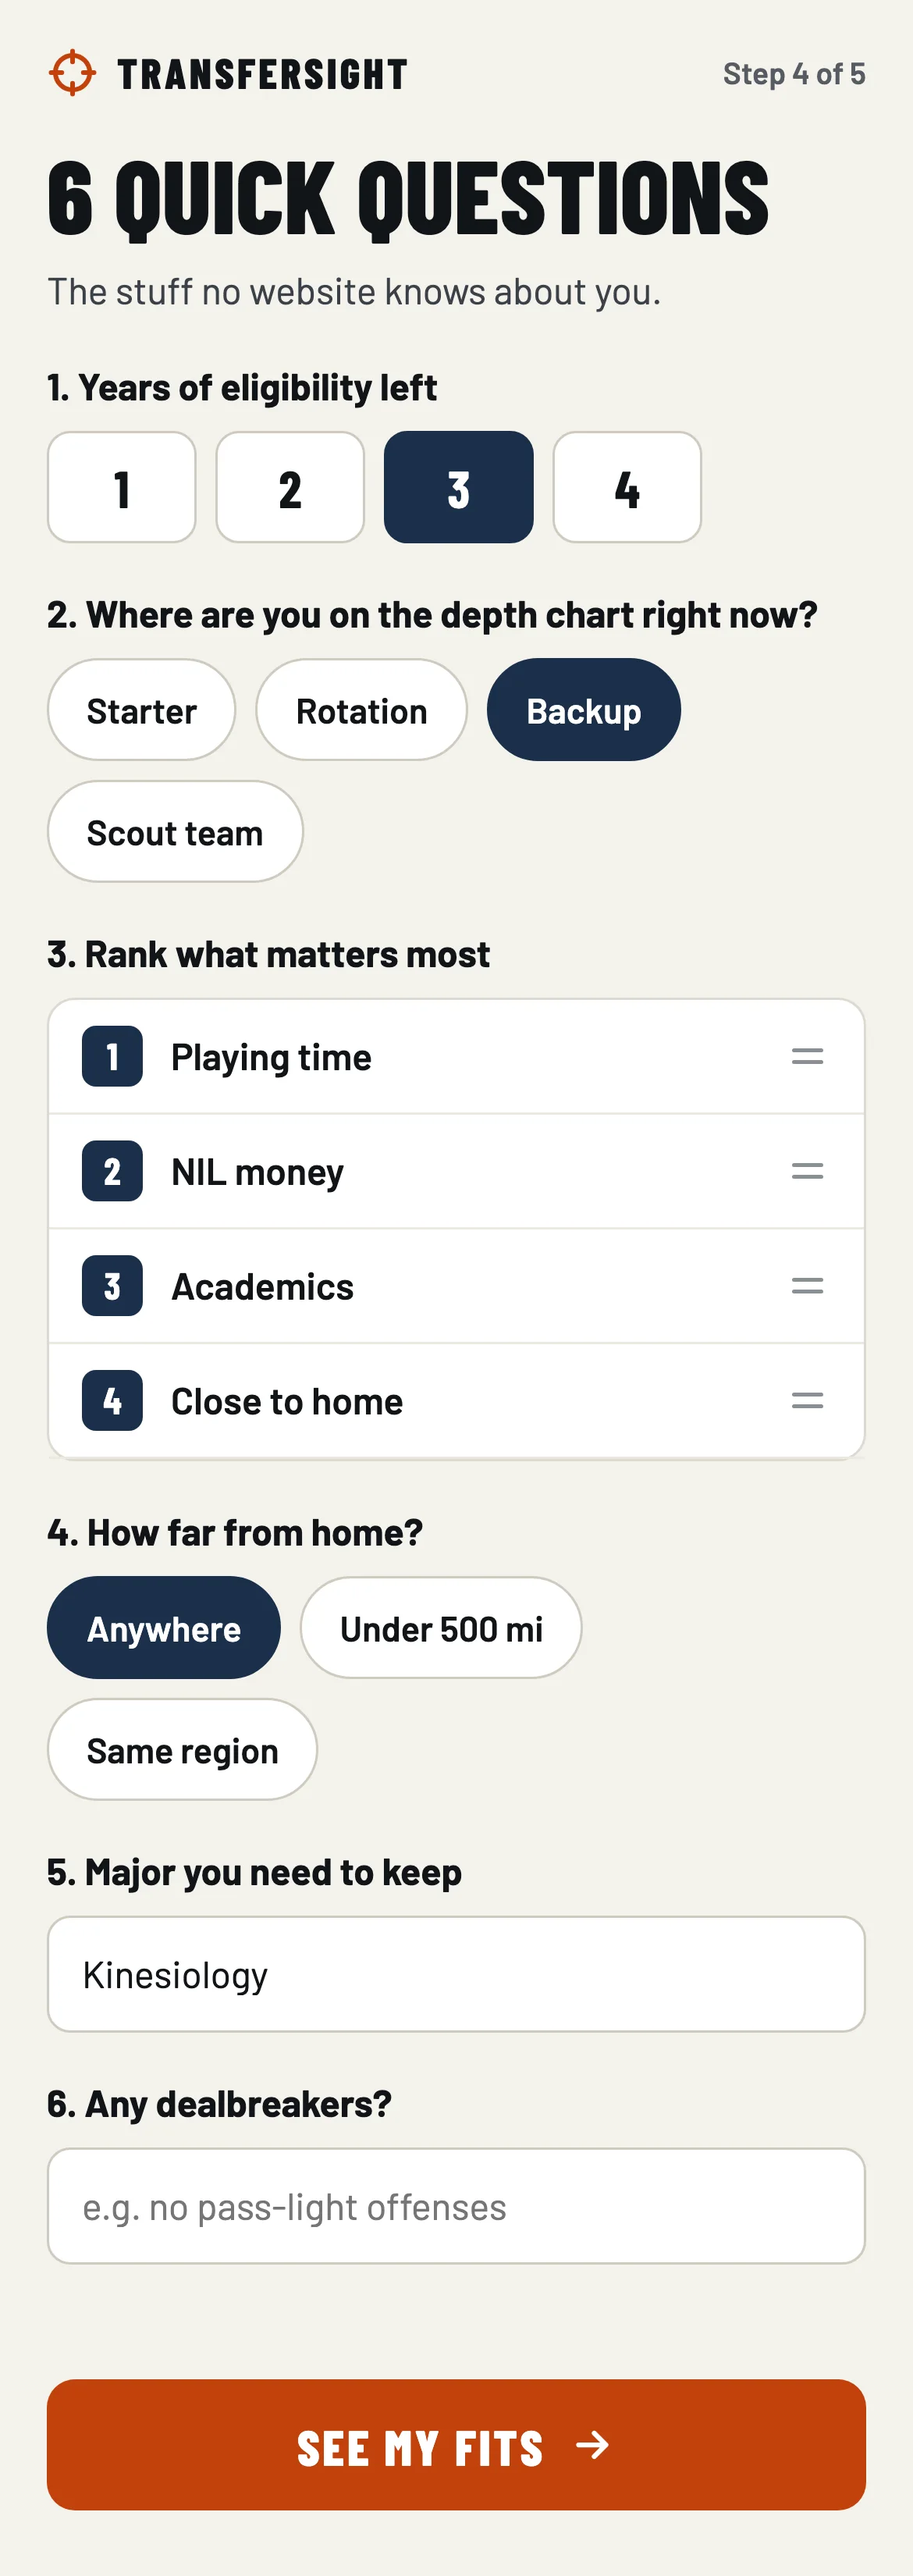
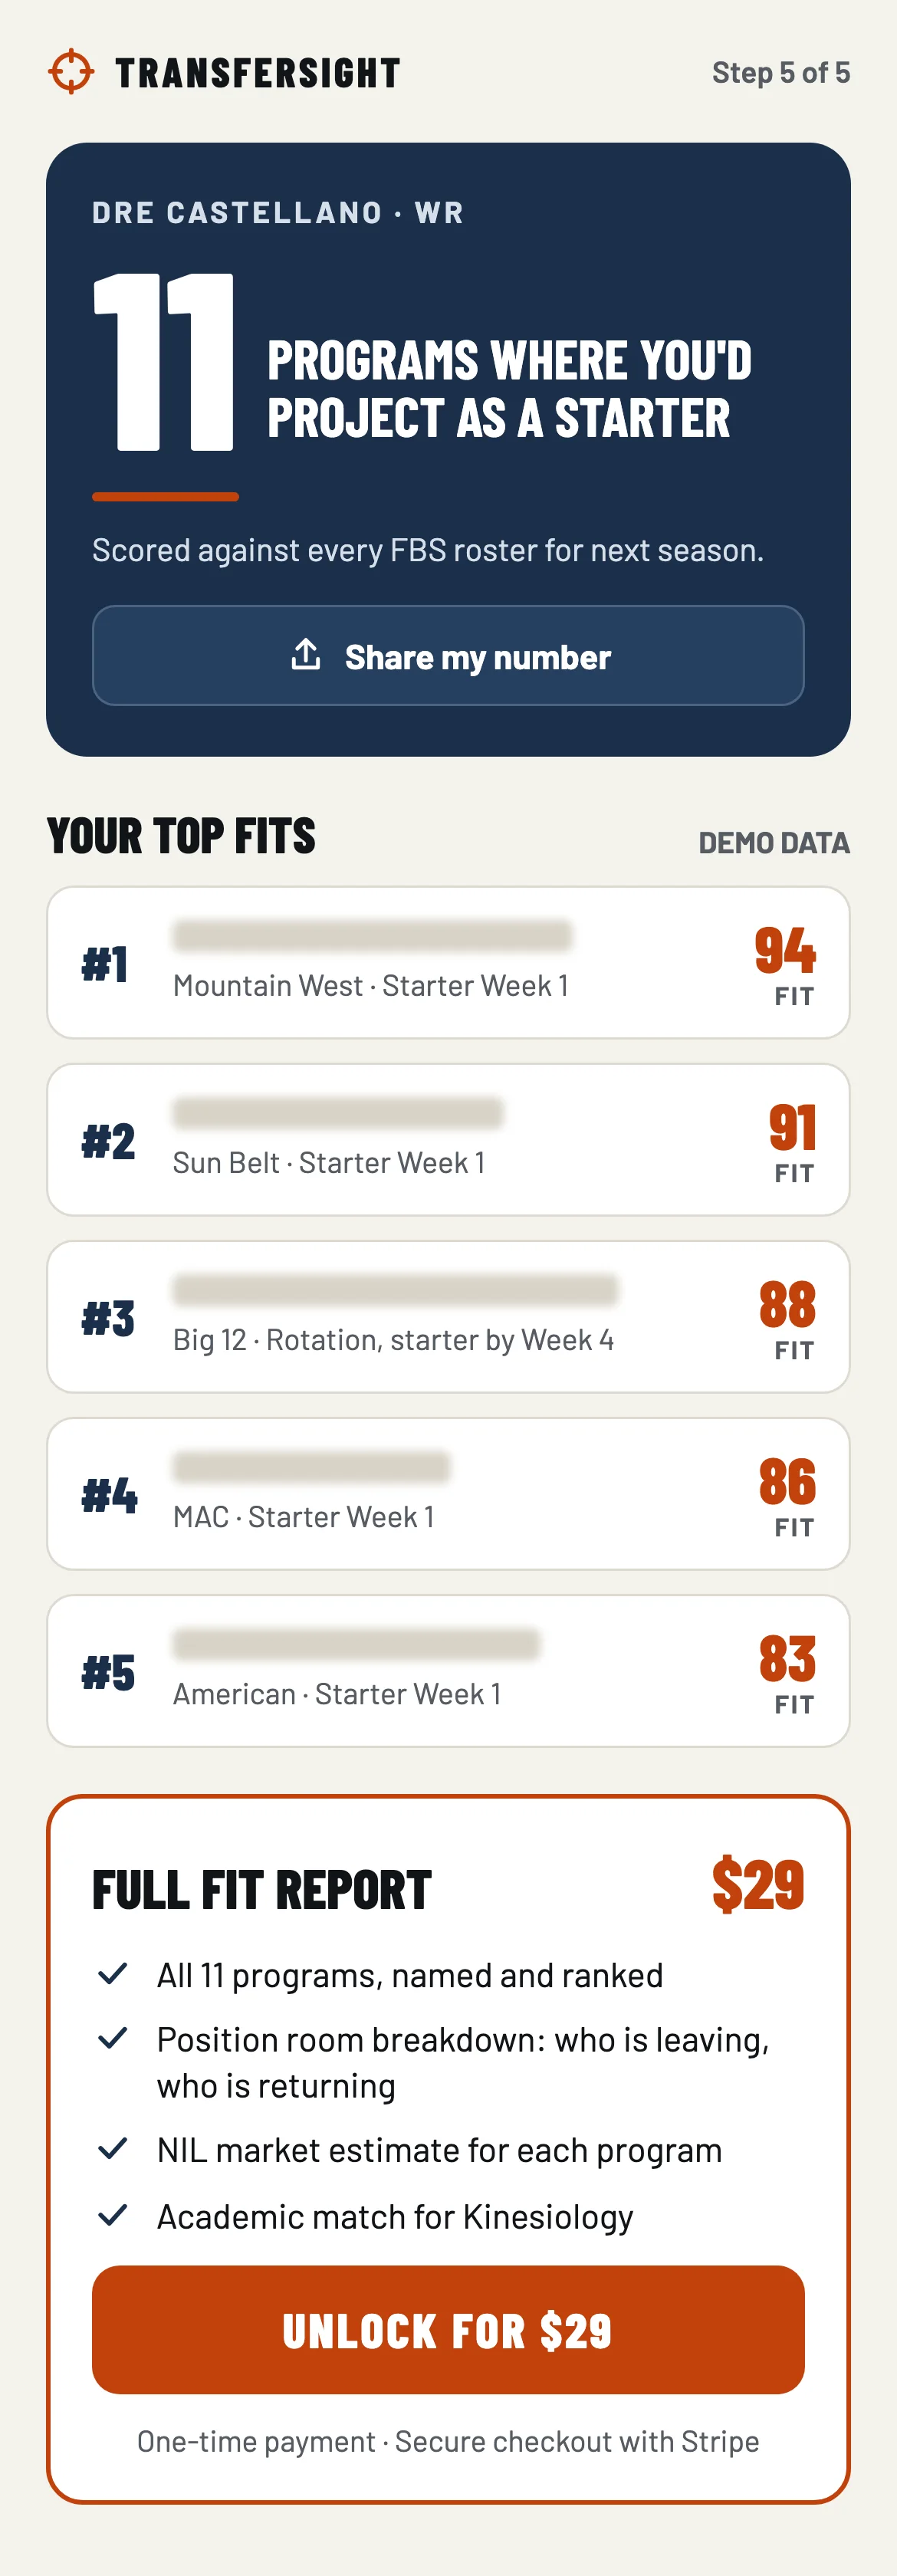
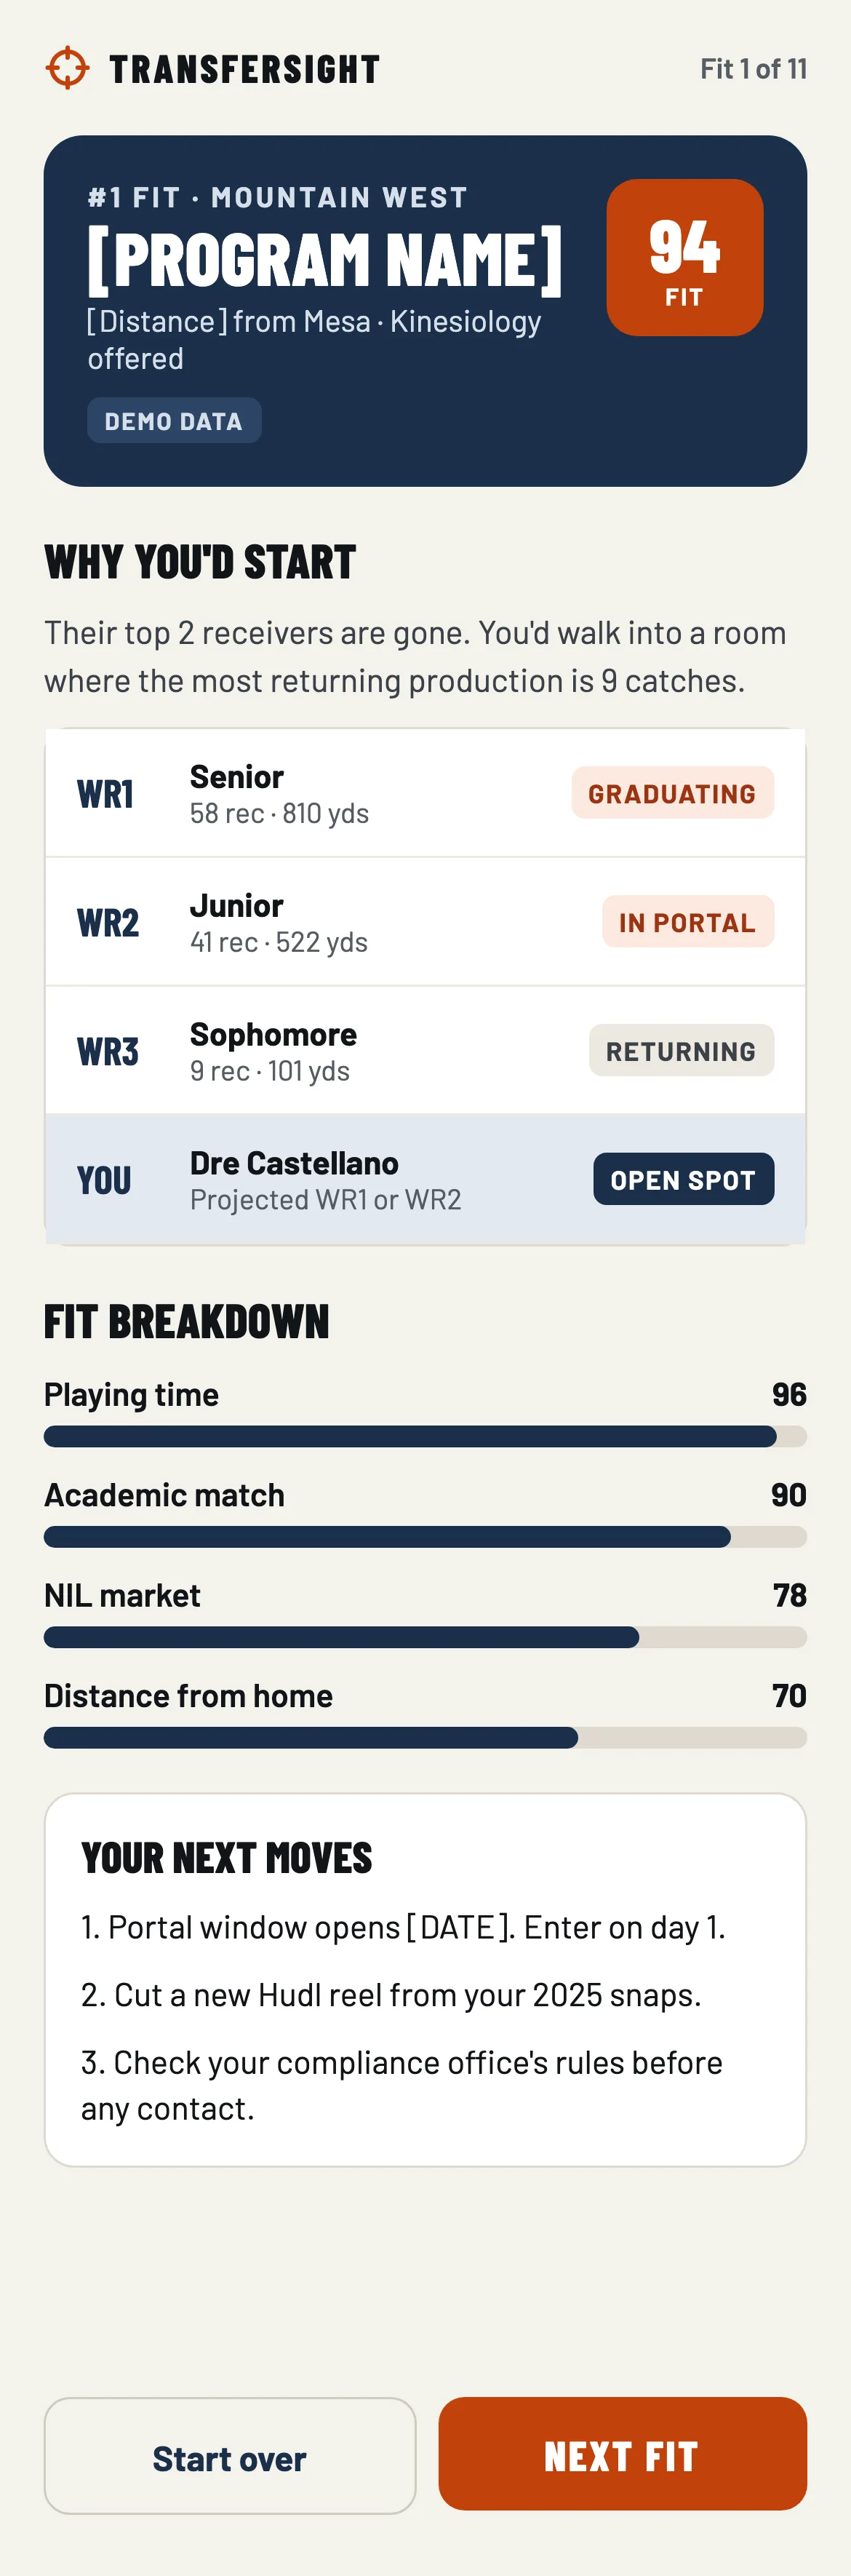
Three decisions shape the flow:
- Confirm before scoring. The search is automatic, so it can be wrong. The athlete sees every field with its source and fixes anything wrong before it is scored, and a match the system is unsure about lands here instead of being trusted. Data the athlete confirms is never overwritten by a later scrape.
- The athlete sets the weights. Ranking playing time, NIL money, academics, and distance sets how much each counts.
- The number is free; the names are paid. The free result shows how many programs fit, with each one's conference, projection, and fit score. Only the program names wait for payment.
Trust
Parents are probably the buyers, and they will ask why their kid got a 94. So the fit score is plain math with no AI model in it: six signals, each with a weight the family can see. AI handles fuzzy jobs, such as matching a player's name to a roster row, and writes the summary for each program, but it never sets the score. Anything it is unsure about goes back to the athlete to confirm.
Other rules come from the same place:
- Honest when the answer is stay. Every report includes a stay-or-go read.
- No contact with coaches. TransferSight never reaches out to programs, and the report tells athletes to check with their compliance office first.
- Private. Nobody at the athlete's school is told who ran a lookup.
- No ID photos or selfies. A verified athlete confirms a code sent to their school email instead. Photos would add friction and a paid vendor or manual review, and would mean holding biometric data on 17 to 22 year olds.
- Labeled. Every projection says it is a projection, and every sample says it is sample data.
The six signals, with sample weights for an athlete who ranked playing time first:
- Room opening, 0.30: production leaving at your position.
- Competition, 0.22: returning depth, signees, and committed transfers.
- Your production, 0.18: per-game efficiency, games played, recruiting rating.
- Eligibility fit, 0.12: your seasons left.
- Academics, 0.10: your major offered, credits likely to transfer.
- Distance, 0.08: how far from home you're willing to go.
The landing page
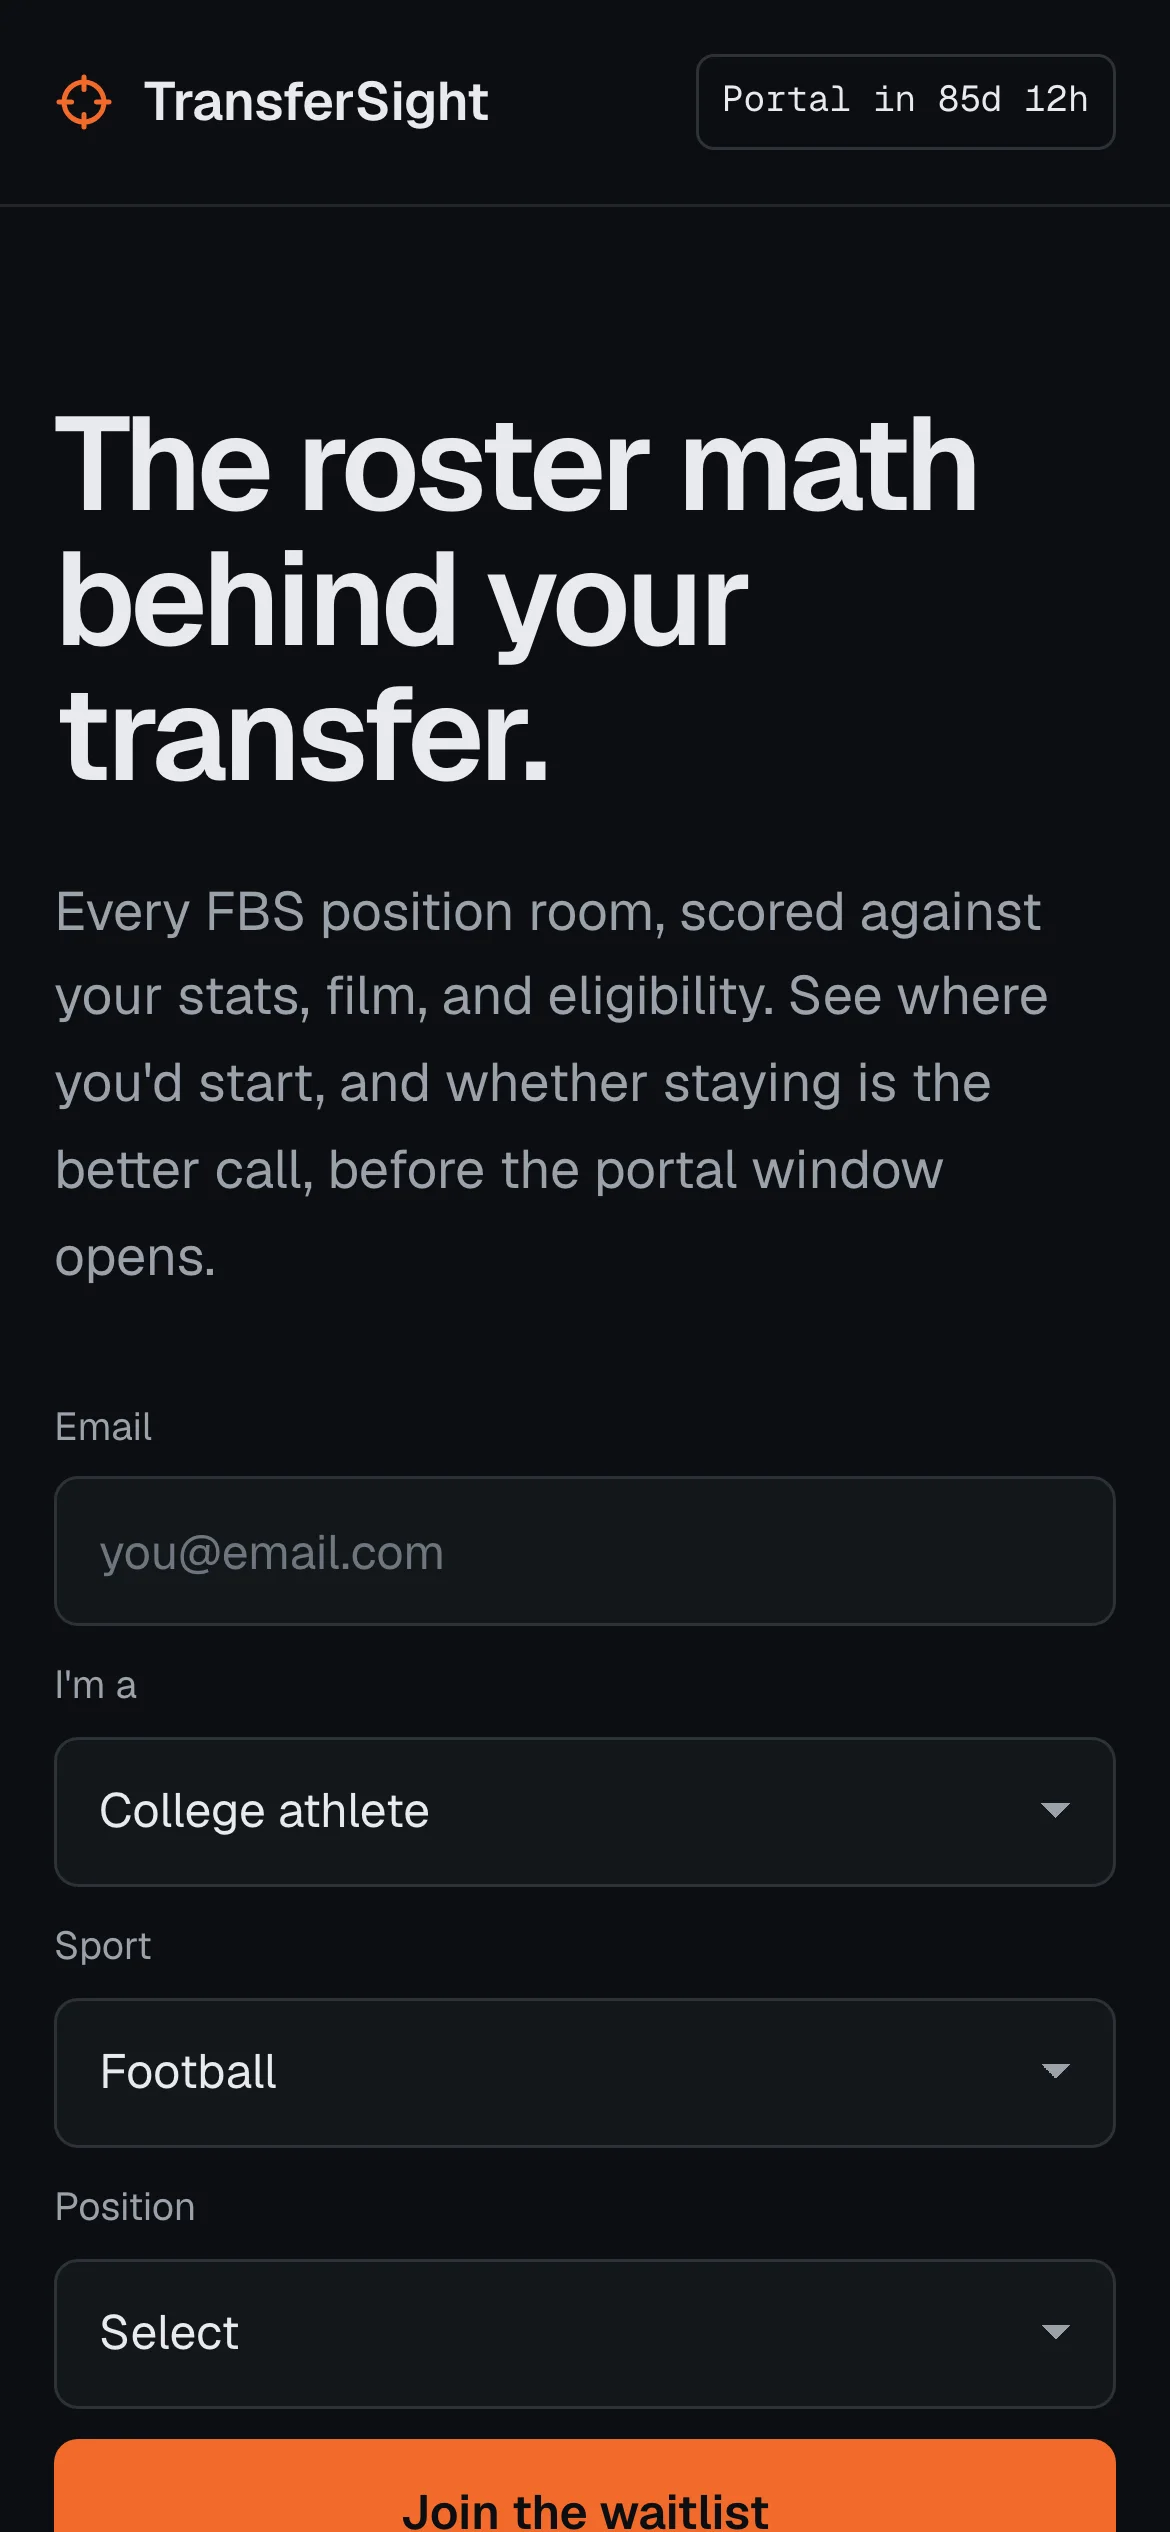
The landing page went live on September 30, 2026, with a waitlist. It uses the "scouting data" direction I picked from three: dark, data-forward, numbers in a monospace face, and one orange accent. It shows a sample report, labeled as sample data, so a family sees the output before signing up.
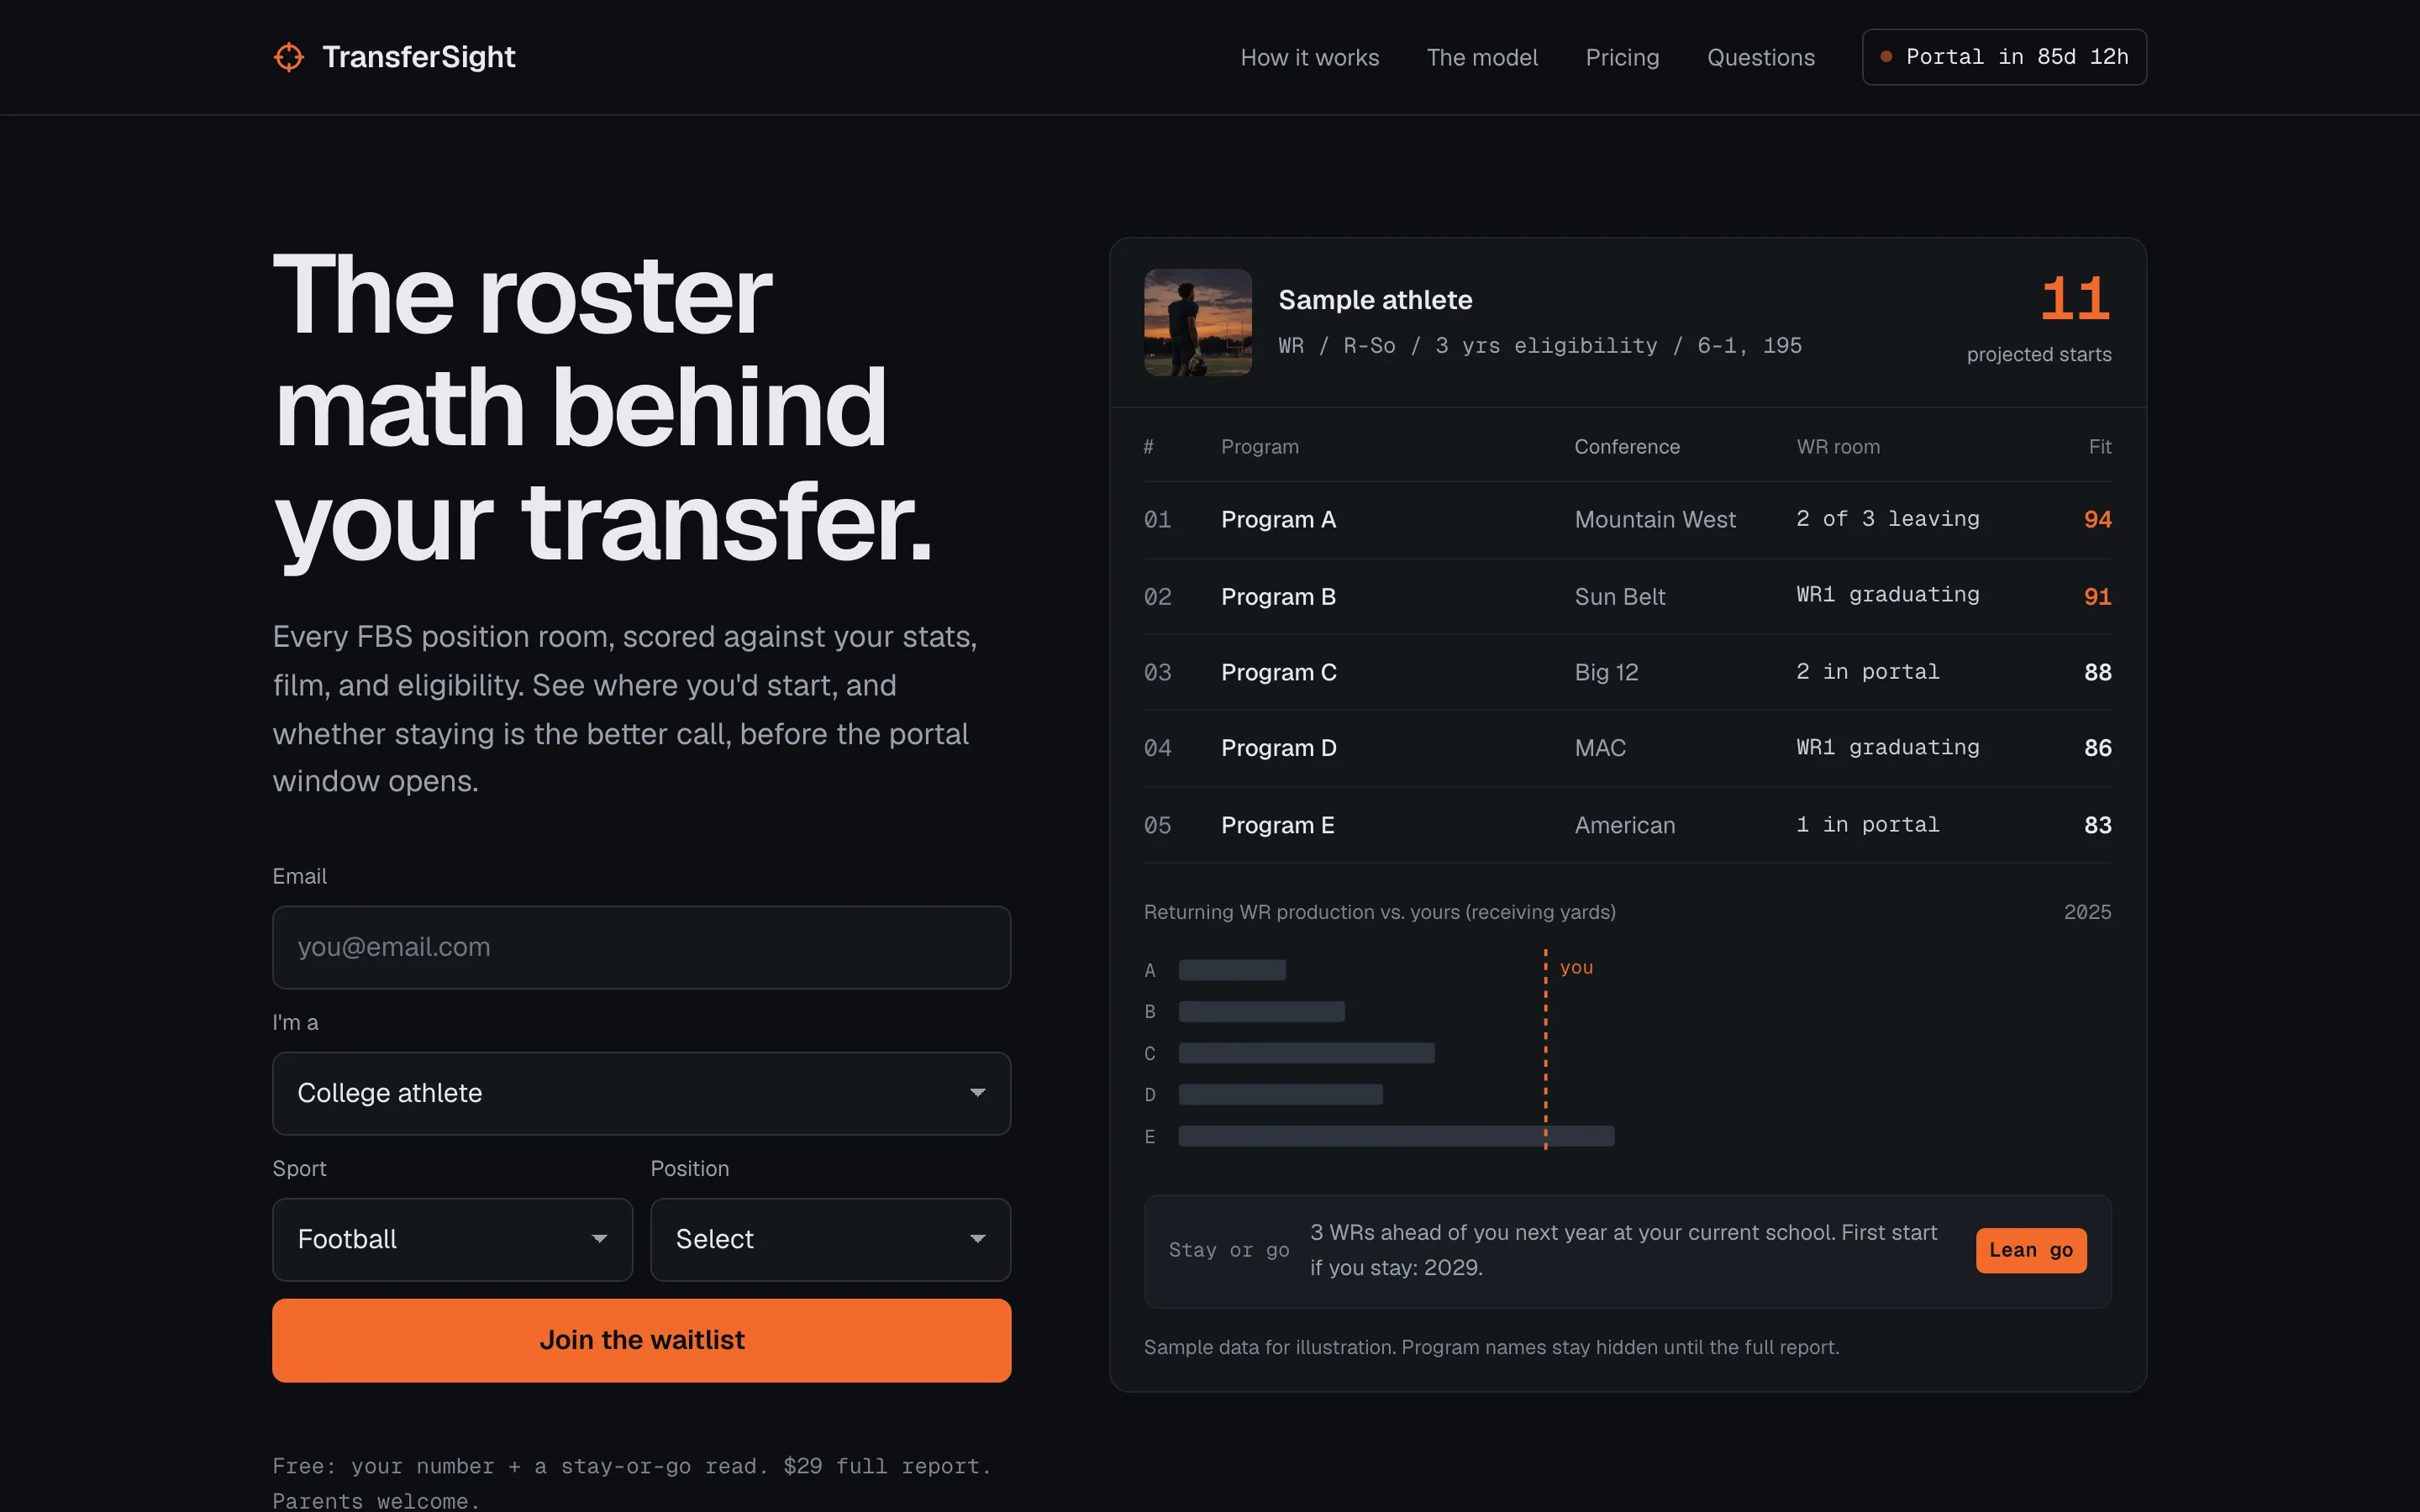
The photos on it are AI-generated, of fictional athletes, with no logos or school marks.
Building it
The report is only as good as its data, so the data work started first. History cannot be collected later.
- Every FBS program, every week. All 138 programs are in the database. A weekly job stores every roster page as raw HTML, then a parser turns it into clean rows: position group, class year, height, weight, and hometown. The first full cycle, on October 3, 2026, stored and parsed all 138.
- Fail safe. A run that finds fewer than 70 or more than 200 players fails and keeps last week's data instead of loading a broken page.
- No person in the loop. The plan is that my one weekly job is a digest email of failed or flagged pages. Anything that would need someone every week is stopped before it is built.
The stack is Supabase for the database and scheduled jobs, a static landing page on Vercel, and Next.js for the app when it is built.
Limits and next steps
The app is not built. The prototype uses an early navy and orange look; the real app will use the landing page's dark direction, with the same flow, fields, and copy. The prototype also shows an NIL estimate that I removed from the landing page until there is a data source for it.
No reports have been sold, and the interviews with athletes and parents have not happened. The price is not tested, and the scoring has to pass a test against past seasons of real transfers before the paid report ships.
Next:
- Interview 5 athletes and 5 parents. The key question: would you trust a report that told you to stay?
- Season stats and the scoring engine, then the backtest.
- The public room pages, then the lookup flow.